
Where is FTSE China A50 Index moving to?
After posting 4 consecutive bearish candles in 7 days, you may start considering where FTSE China A50 Index is heading next, a continuation of the current downward trend, or a reversal in the previous direction.

Australia 200 Index experienced an exceptionally large movement
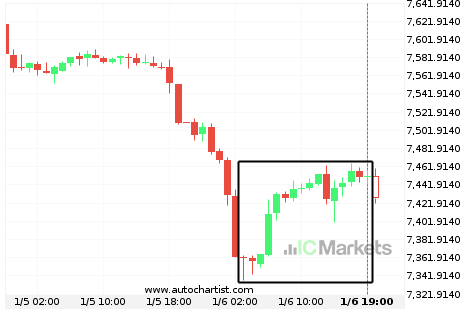
For those of you that don’t believe in trends, this may be an opportunity to take advantage of an exceptional 1.22% move on Australia 200 Index. The movement has happened over the last 16 hours. For those trend followers among you, you may think about riding this possible trend.
Australia 200 Index experienced an exceptionally large movement
For those of you that don’t believe in trends, this may be an opportunity to take advantage of an exceptional 1.22% move on Australia 200 Index. The movement has happened over the last 16 hours. For those trend followers among you, you may think about riding this possible trend.

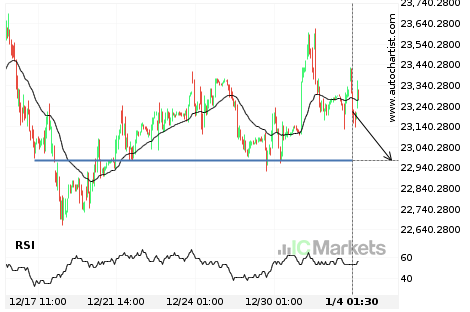
Australia 200 Index – getting close to psychological price line
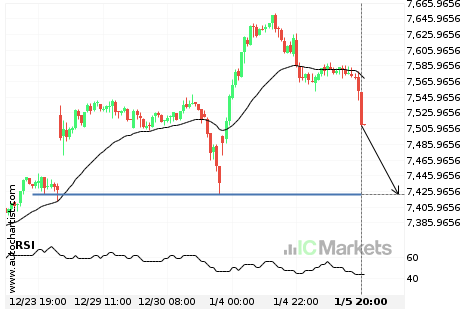
Australia 200 Index is moving towards a support line. Because we have seen it retrace from this level in the past, we could see either a break through this line, or a rebound back to current levels. It has touched this line numerous times in the last 14 days and may test it again within […]
Australia 200 Index – getting close to psychological price line
Australia 200 Index is moving towards a support line. Because we have seen it retrace from this level in the past, we could see either a break through this line, or a rebound back to current levels. It has touched this line numerous times in the last 14 days and may test it again within […]
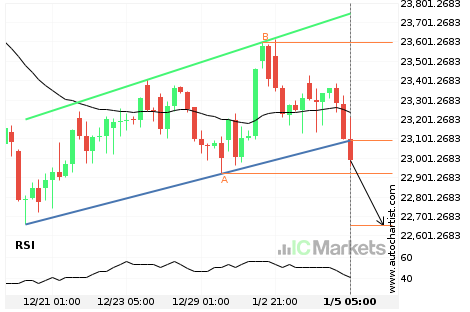
Should we expect a bearish trend on Hong Kong 50 Index?
The breakout of Hong Kong 50 Index through the support line of a Channel Up could be a sign of the road ahead. If this breakout persists, we may see the price of Hong Kong 50 Index testing 22655.7046 within the next 3 days.
Should we expect a breakout or a rebound on Hong Kong 50 Index?
The movement of Hong Kong 50 Index towards 22976.1992 price line is yet another test of the line it reached numerous times in the past. We could expect this test to happen in the next 2 days, but it is uncertain whether it will result in a breakout through this line, or simply rebound back […]

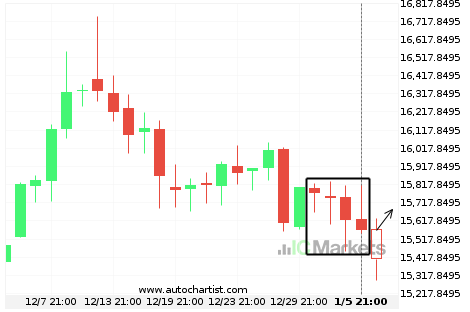
Either a rebound or a breakout imminent on FTSE China A50 Index
FTSE China A50 Index is heading towards the support line of a Falling Wedge. If this movement continues, the price of FTSE China A50 Index could test 15559.7900 within the next 3 days. It has tested this line numerous times in the past, so this movement could be short-lived and end up rebounding just like […]
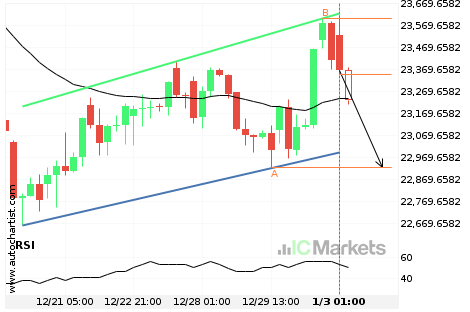
Will Hong Kong 50 Index have enough momentum to break support?
Hong Kong 50 Index is heading towards the support line of a Channel Up and could reach this point within the next 2 days. It has tested this line numerous times in the past, and this time could be no different from the past, ending in a rebound instead of a breakout. If the breakout […]